Mixing Performance Prediction of Detergent Mixing Process Based on the Discrete Element Method and Machine Learning (1)
1. Introduction
The customization of products is a growing trend, as revealed by studies such as [1], mainly due to the combination of the DIY approach and the use of new digital technologies. In this context, the concept of small-scale digital manufacturing has been researched in the DIY4U European project to be applied in the manufacturing of customized fast moving consumer goods, particularly powder and liquid detergents. A machine and a digital platform were developed, so that the machine manufactures a customized detergent according to the needs that the clients indicate on the digital platform connected to the machine. This machine is modular and contains tanks with the liquid and powder components, and all the modules needed to manufacture the formulation from the components. The manufacturing of powder detergent is performed according to the following steps: an empty cup is placed in the machine, a certain amount of every formulation component is poured into the cup, the lid is placed on it, then the closed cup is positioned in the mixer, which mixes the components to obtain the mixture by replicating the Turbula® (Willy A. Bachofen AG, Muttenz, Switzerland) movement, and finally the machine provides the cup with the customized detergent.
In a powder mixing process, a homogenous mixture is a requirement to obtain a quality product. As it is a process of manufacturing customized detergent, the amount of the components can be different for each mixing process that the machine makes, so the mixing performance must be analysed to assess the quality of each final product. For this reason, it is intended to include a Digital Twin in the digital platform that is able to predict, in real time and before ordering the fabrication to the machine, the mixing performance of the mixing process considering the initial components and the operation parameters (mixing time and mixer speed). To achieve this objective, a model of the powder mixing process can be obtained that allows us to analyse the mixing performance of the final mixture, and result data extracted from this model can be used to predict the quality mixing in real time without experimental test.
One of the methods widely used to model the behaviour of a particle flow is the discrete element method (DEM), a numerical method developed for mining applications initially as in [1], and whose use has spread to other sectors, such as agriculture [2], food [3] or pharmacy [4], where the study of the behaviour of granular materials subjected to different processes is of great interest. There are studies that have employed DEM to model an operation process, and after calibrating the model with experimental results, use this model to analyse the effect of some parameters on the process efficiency [5,6].
The mixing process is one of the most used processes in industries handling powders, where to achieve a homogenous mixing is of great importance for making a quality product. By this reason, several types of mixers have been developed, among which is the 3D mixer, based on the Turbula® movement, that has been used in the DIY4U project. An experimental analysis of the powder behaviour in a Turbula® mixer has been carried out in [7]. On the other hand, several works [8,9] have analysed the mixing performance of several mixers, as well as the influence of various process parameters on it, by using the DEM simulation [10,11,12]. Therefore, the DEM method was identified as the best option to model the mixing process of the powder detergent and to analyse its mixing performance.
The study of the variables of a process can help to assess and optimize the performance or efficiency of the process [13,14]. In order to analyse certain variables of a process and to make predictions about it based on data collected from tests and sensors, machine learning methods were used to interpret and learn the patterns in the data structure. Machine learning is seeing a significant growth and is being adopted in widespread applications across a broad array of industries and fields.
By the application of supervised machine learning algorithms to an input dataset, models used to predict new datasets not included in the initial dataset can be built, as seen in [15]. Among these algorithms, the regression ones are frequently utilized to predict the value of an output variable as a function of the values of an input variable group, as well as to study the effect between all the variables. In this work, the DEM method has been used to model the mixing process of the powder detergent, which has been validated through experimental test. After that, this model has been employed to study the mixing performance of the process and the effect of the initial quantity of the formulation components and the operation parameters (mixing time and speed mixer) on it. Moreover, an input dataset of the process has been generated from the DEM model considering the whole range of every input variable. This input dataset has been used to obtain a model by the application of a multivariate polynomial regression algorithm that allowed us to predict the mixing index of the powder mixing process in real time without performing simulations or experimental tests, and to analyse the effect of the input variables on the mixing index of the process.
2. Computational Model
The mixing process of powder detergent is carried out in a 3D mixer, shown in Figure 1, that replicates the Turbula® movement with a constant speed of 45 rpm. The components utilized to obtain the formulation are surfactant particles, sodium sulphate, sodium carbonate, coloured speckle, and liquid nonionic surfactant. Initially, every component is poured into the cup individually, except surfactant particles and liquid nonionic that are premixed before being poured. The cup has a capacity of 565 mL, and it was defined as having a filling grade of 70%. The properties of formulation components are shown in Table 1.
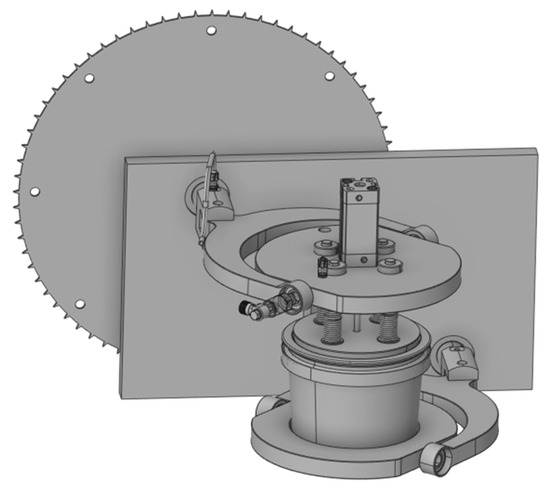
Figure 1. Geometry of the mixer.
Table 1. Properties of formulation components.
| Component | Particle Size Median (µm) | Bulk Density (kg/m3) |
| Surfactant Particle | 443 | 830 |
| Sodium Sulphate | 207 | 1550 |
| Sodium Carbonate | 655 | 1150 |
| Coloured Speckle | 1000 | 800 |
| Liquid Nonionic Surfactant | - | 8001 |
The mixing process has been modelled by the DEM method, which is typically used to study the behaviour of individual particles when interacting with each other and boundaries. The particle’s motion is governed by the equation of motion and the contact forces that act on them due to the interactions that occur with other particles and boundaries [6,16]. These contact forces consist of normal force and tangential force, and they are calculated according to the contact model used in the DEM simulation. In this work, the hysteretic linear spring model was selected to calculate the normal force, the linear spring coulomb limit to calculate the tangential force, and a constant adhesive force model to take into account the adhesion due to liquid bridge forces. The gravity action was also taken into account. Rocky DEM 4.4.3 software was used to perform the computational simulation.
From the geometry of the 3D mixer, only the parts that affect the mixing process were included in the DEM model. To model the powder components, spherical particles were used, and the liquid component was modelled as a liquid film added to the particles, and the liquid amount added to each particle can change when particles interact between them. Due to the particle size of the different components, the modelling of the mixture was expected to generate a high number of particles with a high computational cost. Thus, the Same Statistic Weight (SSW) method has been considered, according to [17], by which a scale factor is applied to the particle size of all the components, achieving a reduction in the particle number to be modelled but keeping the initial shape of the particle size distribution. Table 2 indicates the particle size of every component used in the DEM model, as well as the percentage by mass according to a standard formulation. The mechanical properties regarding interactions between particles, and between particles and boundaries, are presented in Table 3. The DEM model at the initial stage of the mixing process is shown in Figure 2, where a certain colour is assigned to every component. Initially, the powder components were totally segregated, and it was considered that the liquid component mass was equally distributed between particles of surfactant component.
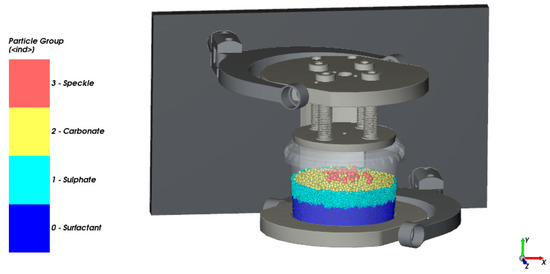
Figure 2. DEM model of the mixing process.
Table 2. Input parameters for DEM model.
| Component | Percentage by Mass (%) | Particle Size (mm) |
| Surfactant Particle | 37.8 | 2.215 |
| Sodium Sulphate | 14 | 1.035 |
| Sodium Carbonate | 43.4 | 3.275 |
| Coloured Speckle | 0.7 | 5 |
| Liquid Nonionic Surfactant | 4.2 | - |
Table 3. Mechanical properties from [18].
| Parameter | Value |
| Particle–particle static friction | 0.6 |
| Particle–boundary static friction | 0.4 |
| Restitution coefficient | 0.4 |
| Rolling resistance | 0.001 |
The Turbula® movement is a three-dimensional movement based on the Schatz six-revolute mechanism [19], which has been employed to mixing powders. To replicate this movement, which was analysed in [20,21], an FEM model from the mixer geometry was created, and the parameterized position of every part during a cycle of movement was obtained by a rigid dynamics analysis. These position data were imported to the DEM software and applied to the DEM model. The movement described by the mixer model in each cycle is shown in Figure 3, representing the position of it every 45°.
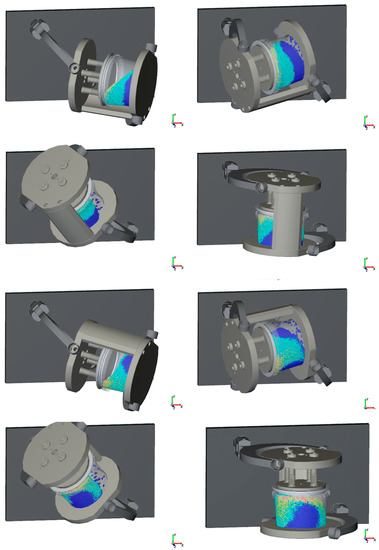
Figure 3. Replication of a cycle of the mixer. Screenshots every 45°.
Moreover, after introducing the mixing time, the DEM model simulates the mixing process up to the indicated time, and later it allows us to obtain the mixing performance of the process, defined as the output parameter, depending on the input parameters, which are time and components mass fraction.
In this study, the created DEM model was used to generate the dataset to estimate the mixing performance based on machine learning. This dataset contains a set of design points, where every point is defined by a certain value for every input parameter, and the corresponding value of the output parameter obtained from the DEM model.
To create the set of design points, the whole range of mass fraction of every component was considered. For that, a design of experiments (DOE) set was defined by the Central composite design (CCD), which is a five-level fractional factorial design that is suitable for calibrating quadratic response models. Using the CCD method, 25 design points were defined which are listed in Table 4.
Table 4. DOE points. Percentage by mass (%) of input parameters.
| Design Point | Surfactant Particle | Sodium Carbonate | Sodium Sulphate | Coloured Speckle | Liquid Nonionic Surfactant |
| 1 | 25 | 0.9 | 72.1 | 1 | 1 |
| 2 | 25 | 0.9 | 68.7 | 1 | 4.4 |
| 3 | 25 | 0.9 | 73.1 | 0 | 1 |
| 4 | 25 | 0.9 | 69.7 | 0 | 4.4 |
| 5 | 25 | 36.7 | 36.3 | 1 | 1 |
| 6 | 25 | 36.7 | 32.9 | 1 | 4.4 |
| 7 | 25 | 36.7 | 37.3 | 0 | 1 |
| 8 | 25 | 36.7 | 33.9 | 0 | 4.4 |
| 9 | 40 | 0.9 | 57.1 | 1 | 1 |
| 10 | 40 | 0.9 | 53.7 | 1 | 4.4 |
| 11 | 40 | 0.9 | 58.1 | 0 | 1 |
| 12 | 40 | 0.9 | 54.7 | 0 | 4.4 |
| 13 | 40 | 36.7 | 21.3 | 1 | 1 |
| 14 | 40 | 36.7 | 17.9 | 1 | 4.4 |
| 15 | 40 | 36.7 | 22.3 | 0 | 1 |
| 16 | 40 | 36.7 | 18.9 | 0 | 4.4 |
| 17 | 32.5 | 18.8 | 45.5 | 0.5 | 2.7 |
| 18 | 25 | 18.8 | 53 | 0.5 | 2.7 |
| 19 | 40 | 18.8 | 38 | 0.5 | 2.7 |
| 20 | 32.5 | 0.9 | 63.4 | 0.5 | 2.7 |
| 21 | 32.5 | 36.7 | 27.6 | 0.5 | 2.7 |
| 22 | 32.5 | 18.8 | 46 | 0 | 2.7 |
| 23 | 32.5 | 18.8 | 45 | 1 | 2.7 |
| 24 | 32.5 | 18.8 | 47.2 | 0.5 | 1 |
| 25 | 32.5 | 18.8 | 43.8 | 0.5 | 4.4 |
© 2023 by the authors. Licensee MDPI, Basel, Switzerland. This article
is an open access article distributed under the terms and conditions of
the Creative Commons Attribution (CC BY) license (https://creativecommons.org/licenses/by/4.0/).

